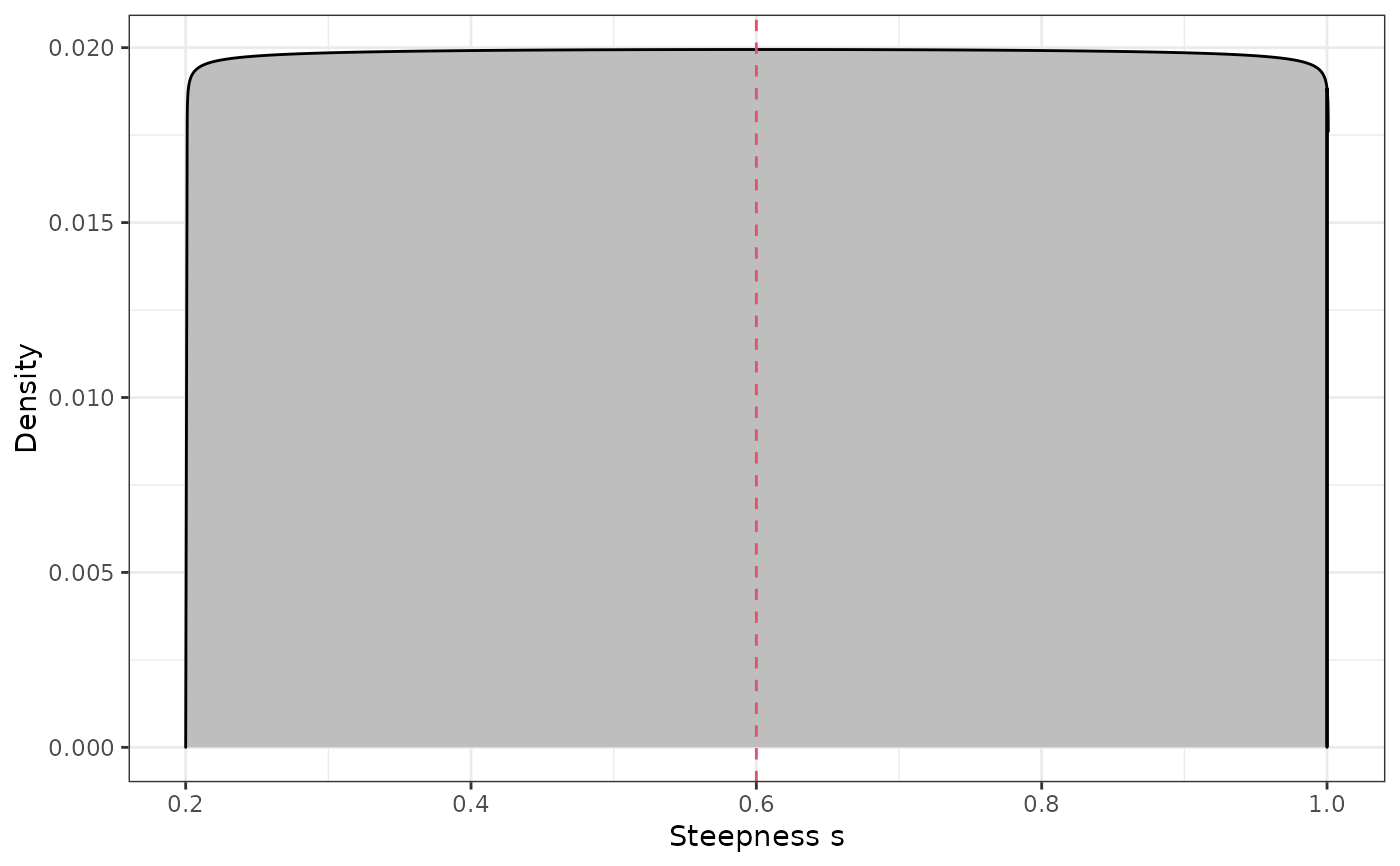
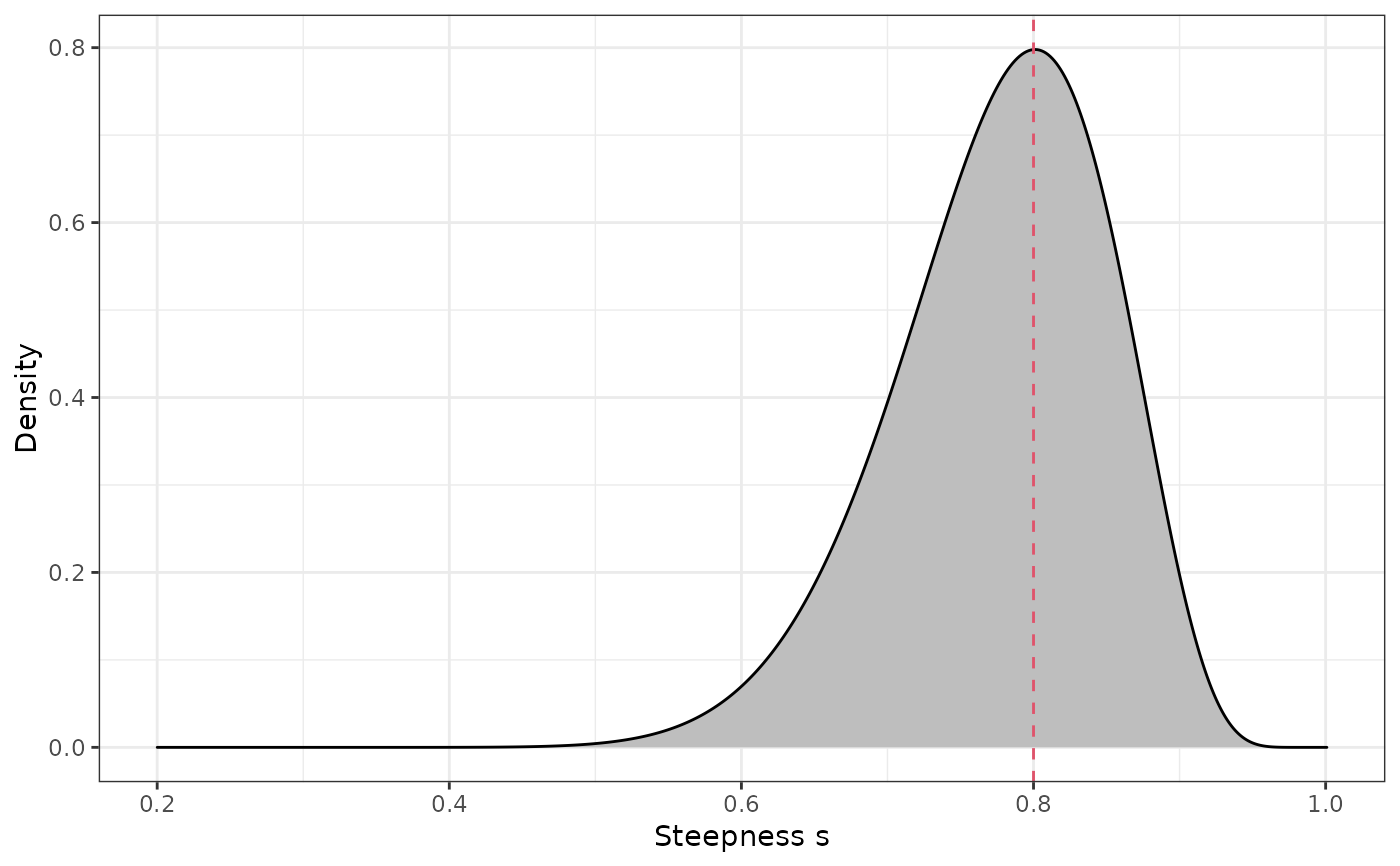
blimprior plot Plots the bounds of the hockey-stick break-point
blimprior.Rdblimprior plot Plots the bounds of the hockey-stick break-point
blimprior(lplim = 0.05, uplim = 0.2, s.logitsd = 20, par = "plim")Arguments
- lplim
steepness, default 0.6 for a approx. uniform prior with s.logistsd = 20
- uplim
s steepness, default 20 for a approx. uniform prior with s = 0.6
- par
parameter on x-axis default "plim", else "sstar"
- s.sdlogit
default 20
Value
ggplot