sprior plot Plots the logit prior distribution for steepness
sprior.Rdsprior plot Plots the logit prior distribution for steepness
sprior(s = 0.6, s.logitsd = 20, ll = 0.2, ul = 1)Arguments
- s
steepness, default 0.6 for a approx. uniform prior with s.logistsd = 20
- s.logitsd
s steepness, default 20 for a approx. uniform prior with s = 0.6
- ll
lower bound of s = 0.2
- ul
lower bound of s = 1
Value
ggplot
Examples
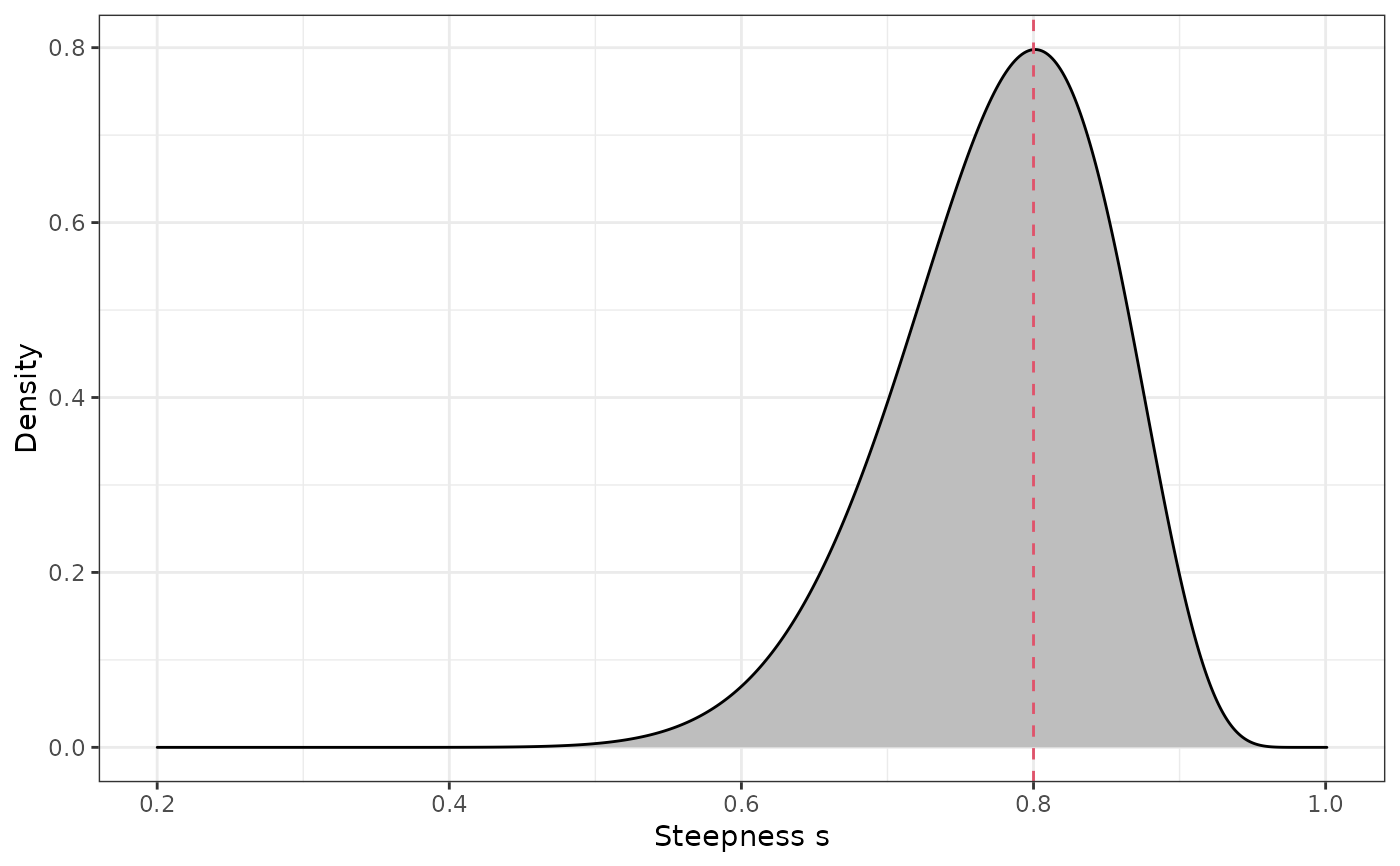
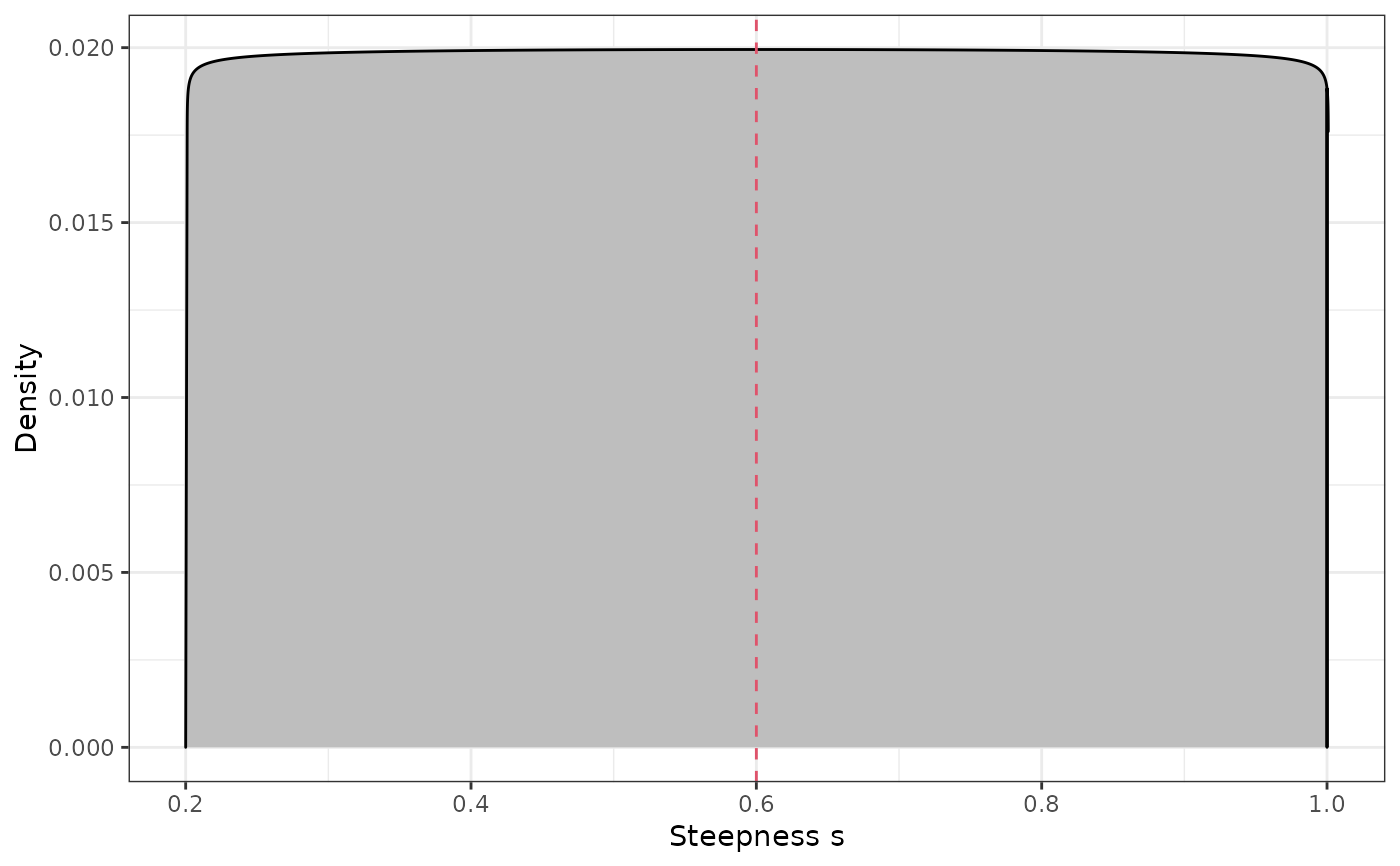
sprior() # approx. uniform with some curving on bounds

sprior(s=0.8,s.logitsd=0.5)