testing
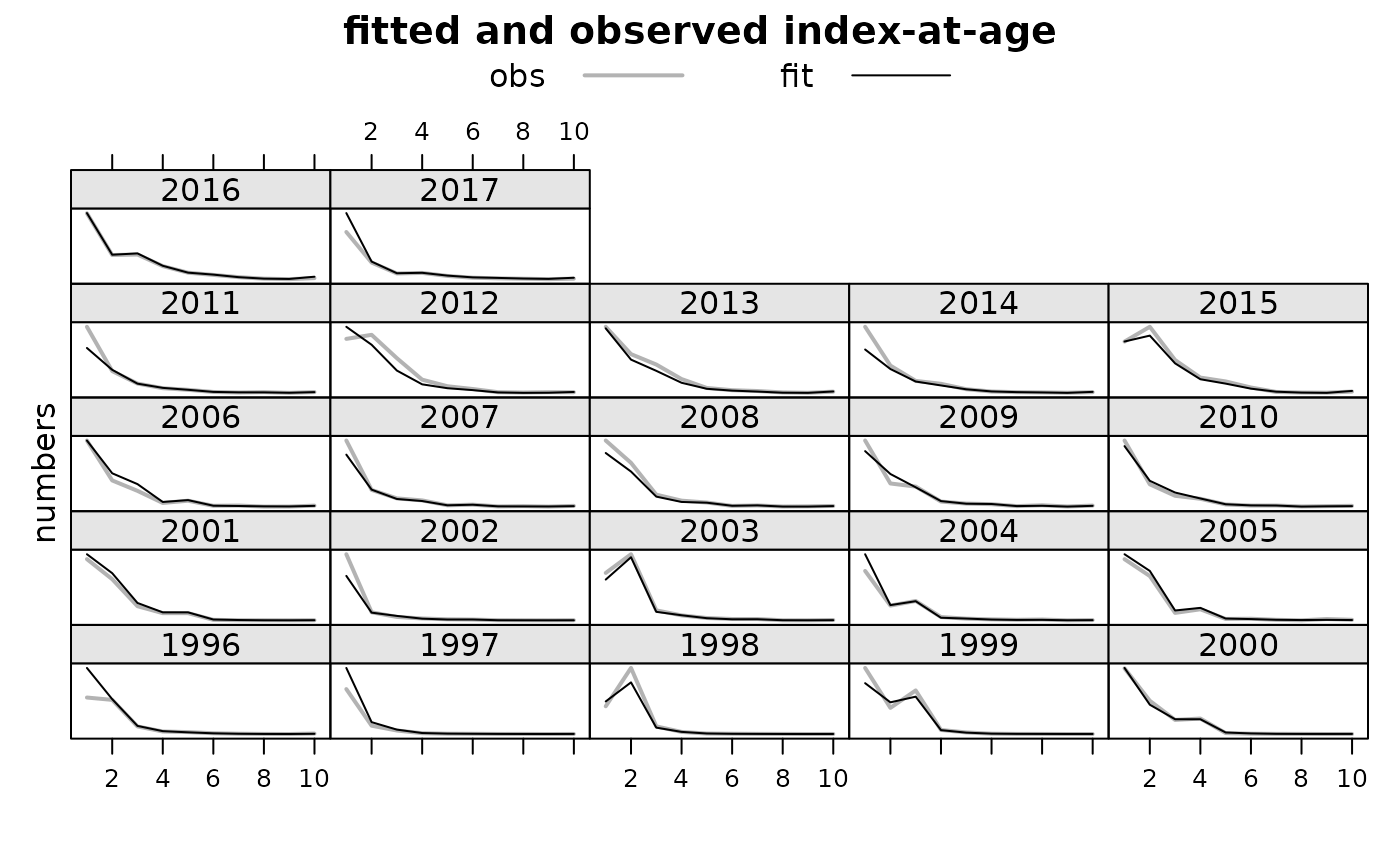
ploti.RdMethod to plot fitted versus observed indices-at-age. Note the yaxis doesn't has a scale. The visual is about the difference between the two lines, not about the value of each line, which in any case would be very difficult to assess visually.
# S4 method for a4aFit,FLIndices
plot(x, y, ...)
Arguments
- x
an
a4aFitobject with the fitted values- y
an
FLIndicesobject with the observed values- ...
additional argument list that might never be used
Value
a plot with fitted and observed indices-at-age