Create diagnostic observation variance plot.
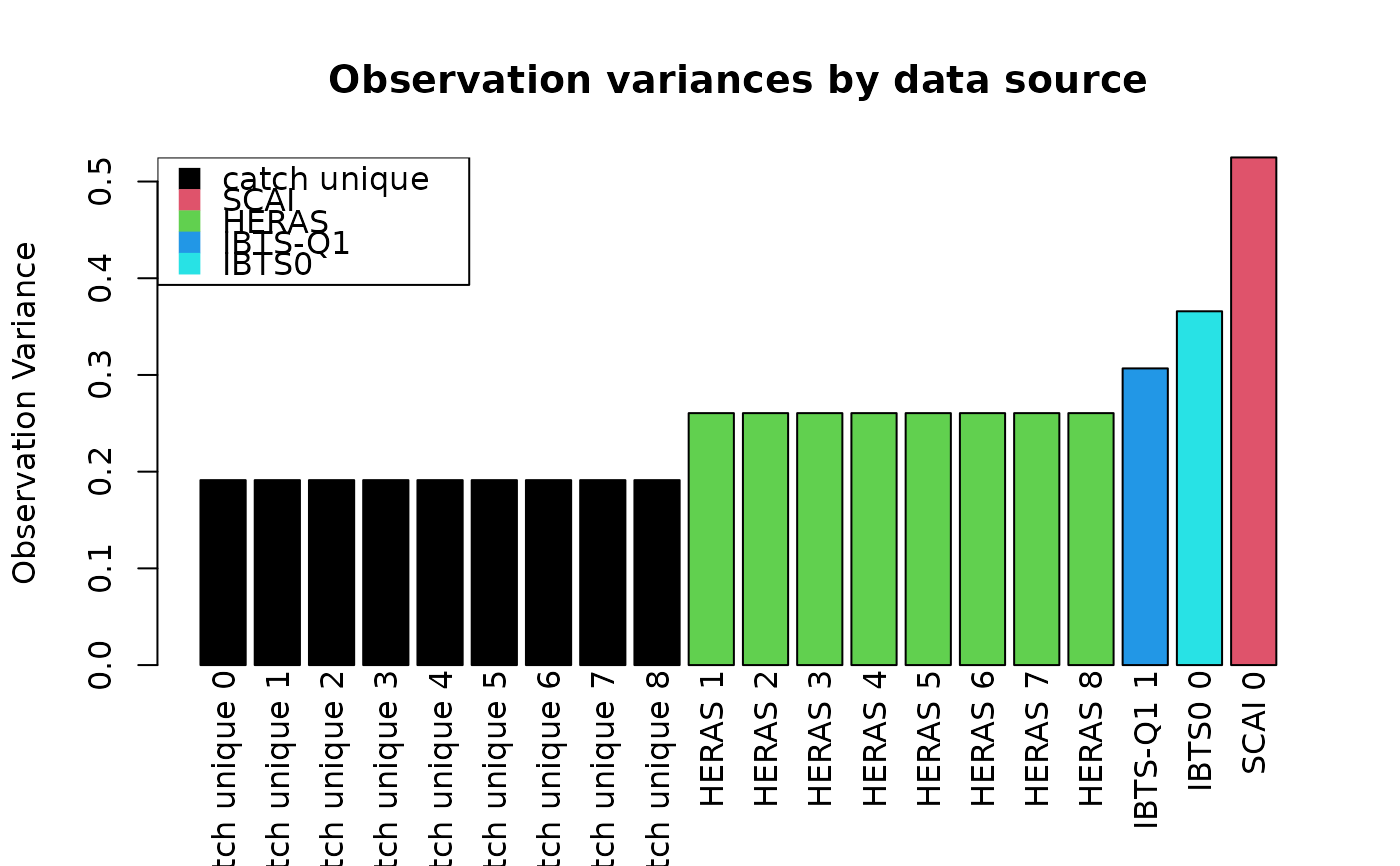
obsvar.plot.RdPlot the estimated observation variance of each data source in the assessment as a sorted barplot.
obsvar.plot(sam)Arguments
- sam
An FLSAM assessment output object
Details
Observation variances in the SAM model are analogous to the "weightings" employed in other model - in this case, they represent how noisy each of the individual tuning fleets are. Close examination of the values of these observation variances can given valuable insight into what the model is doing, and where it thinks the most information is.
Value
A barplot is returned with fleets at the horizontal and observation variance at the vertical axis.
See also
Examples
data(NSH.sam)

obsvar.plot(NSH.sam)