A class for modelling cohorts.
Usage
FLCohort(object, ...)

# S4 method for class 'FLQuant'
FLCohort(object, ...)

# S4 method for class 'FLCohort'
FLCohort(object, units = units(object))

# S4 method for class 'array'
FLCohort(
  object,
  dim = rep(1, 6),
  dimnames = "missing",
  units = "NA",
  iter = 1,
  fill.iter = TRUE
)

# S4 method for class 'vector'
FLCohort(
  object,
  dim = c(length(object), rep(1, 5)),
  dimnames = "missing",
  units = "NA",
  iter = 1
)

# S4 method for class 'missing'
FLCohort(object, dim = rep(1, 6), dimnames = "missing", units = "NA", iter = 1)Details
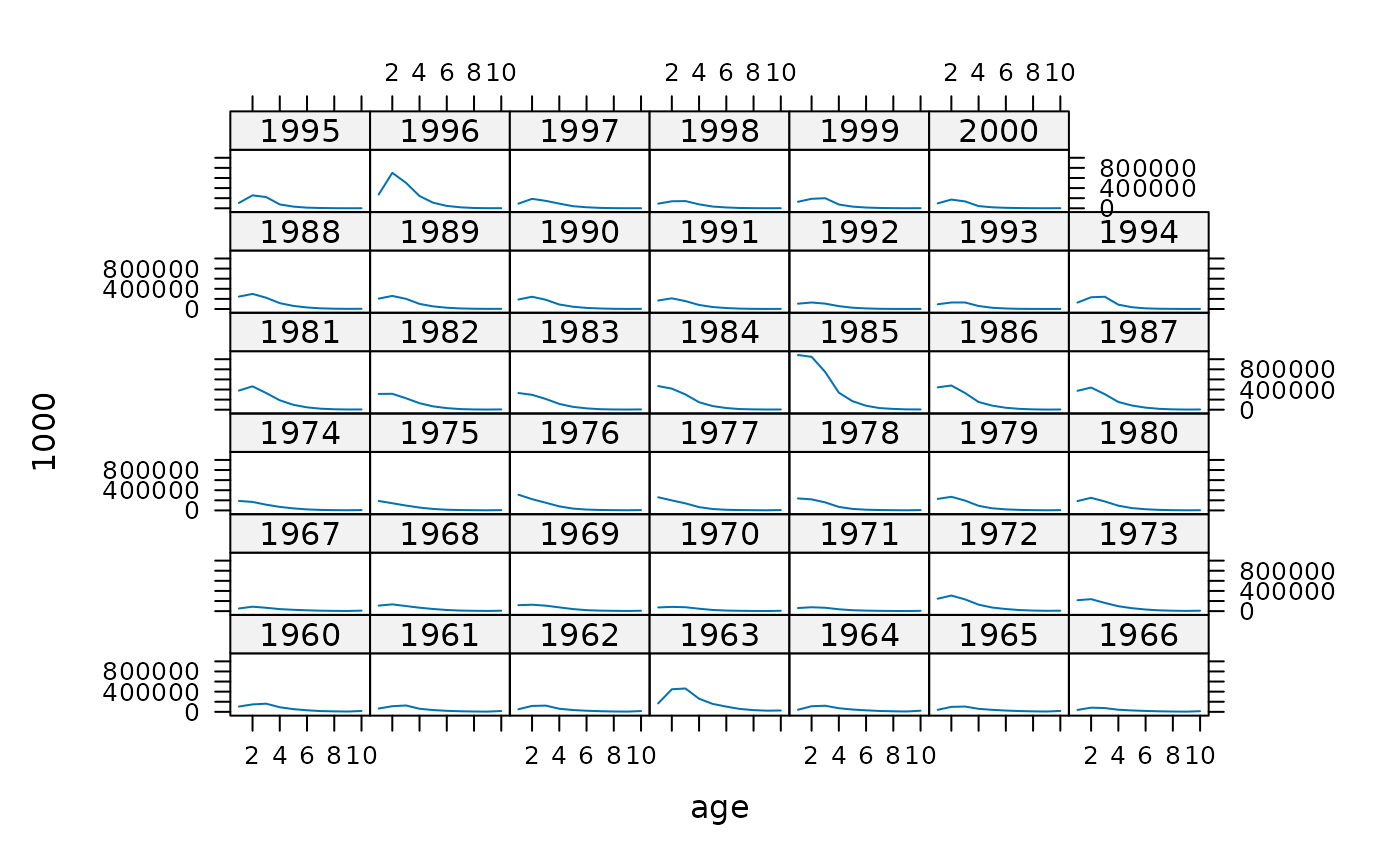
This class represents cohorts in columns. It simply shifts the typical matrix representation where cohorts are found on the diagonals, into a matrix where cohorts are found in columns. It is very usefull for all analysis that want to make use of cohorts instead of years.
Slots
- .Data
Internal S4 data representation.
array.- units
The data units in some understandable metric.
character
Constructor
Objects of this class are generally constructed from an FLQuant object.