Standard plot methods for every FLCore class. FLR plot methods are based on
lattice, and attempt to show a general view of the
object contents.
Usage
# S4 method for class 'FLQuant,missing'
plot(
x,
xlab = "year",
ylab = paste("data (", units(x), ")", sep = ""),
type = "p",
...
)
# S4 method for class 'FLStock,missing'
plot(x, auto.key = TRUE, ...)
# S4 method for class 'FLBiol,missing'
plot(x, y, ...)
# S4 method for class 'FLIndex,missing'
plot(x, type = c("splom"), ...)
# S4 method for class 'FLSR,missing'
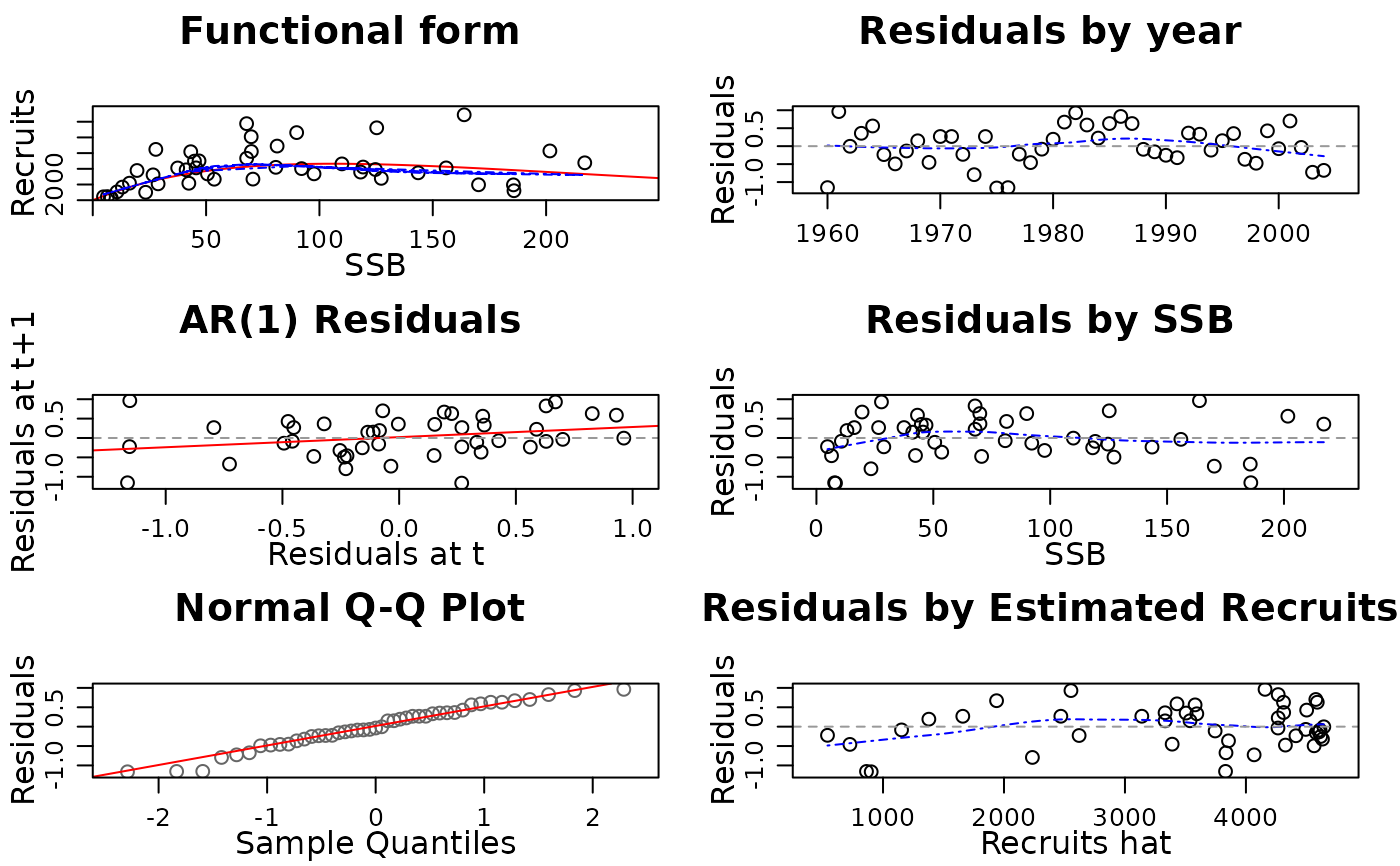
plot(x, main = "Functional form", log.resid = FALSE, cex = 0.8)
# S4 method for class 'FLPar,missing'
plot(x, y = "missing", ...)Details
Users are encouraged to write their own plotting code and make use of the
overloaded lattice methods, for example
xyplot or bwplot. See also
lattice-FLCore.
Examples
data(ple4)
# FLQuant
plot(catch.n(ple4)[, 1:20])
 plot(catch.n(ple4)[, 1:20], type='b', pch=19, cex=0.5)
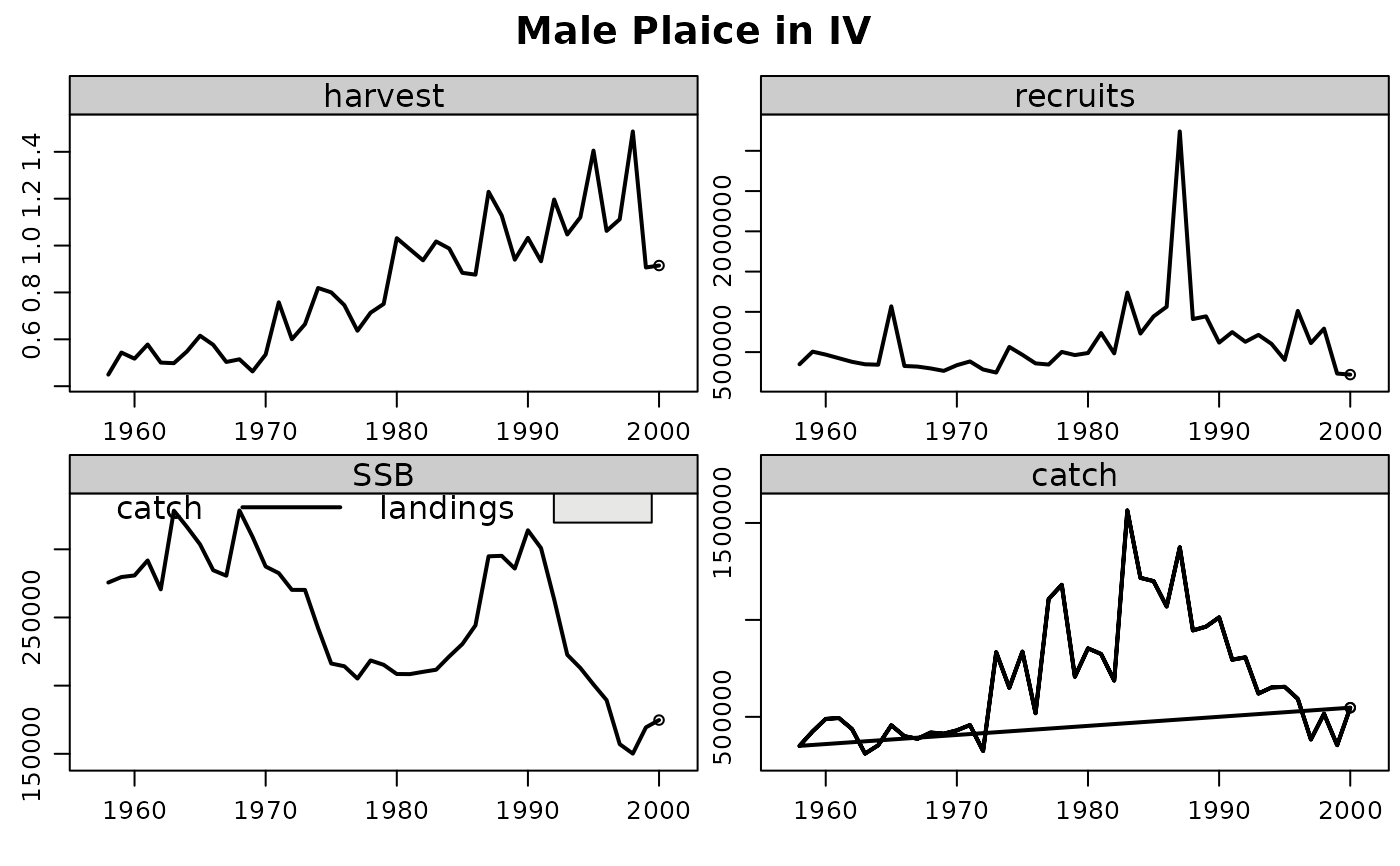
 # FLStock
data(ple4sex)
plot(ple4)
# FLStock
data(ple4sex)
plot(ple4)
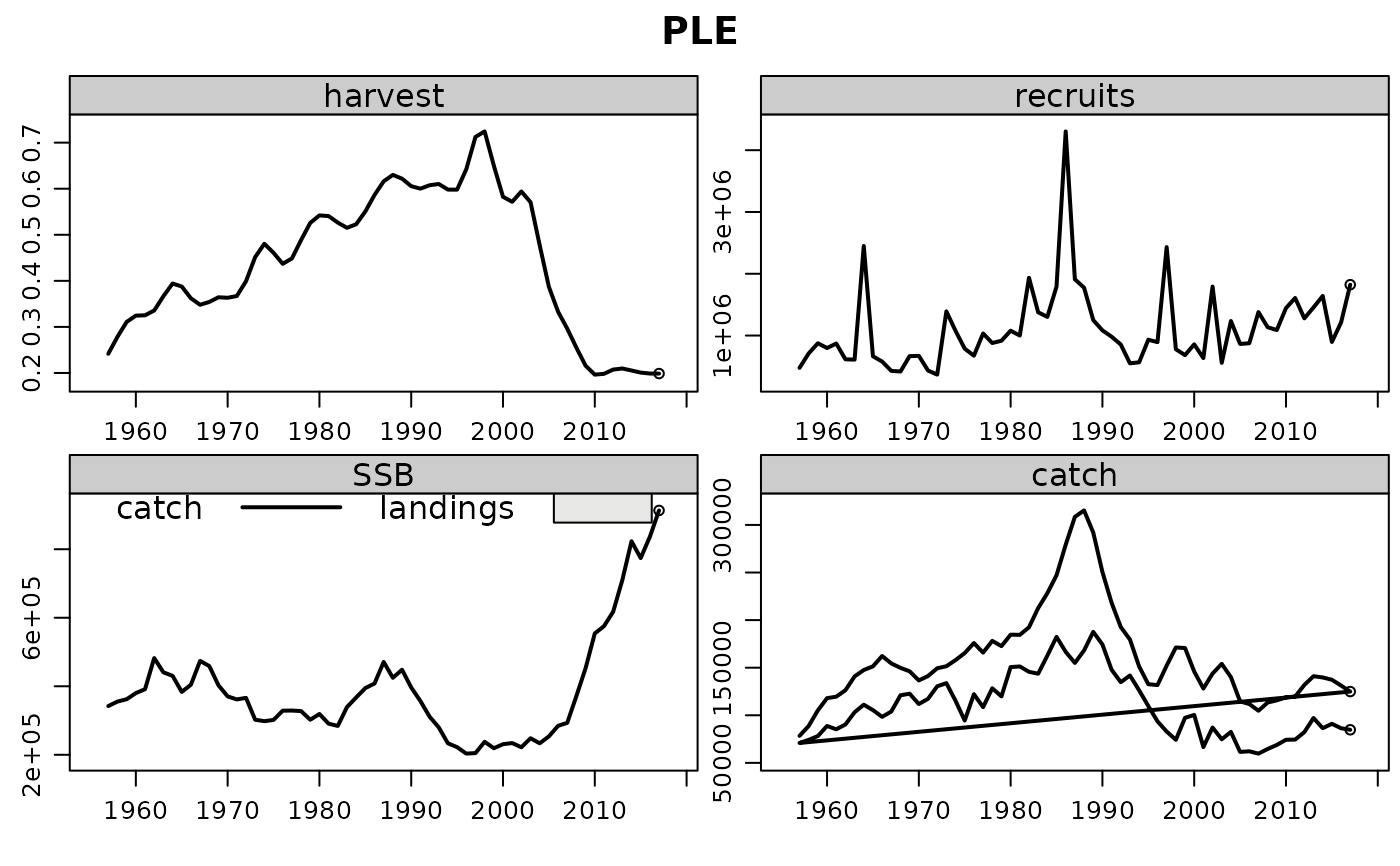 plot(ple4sex)
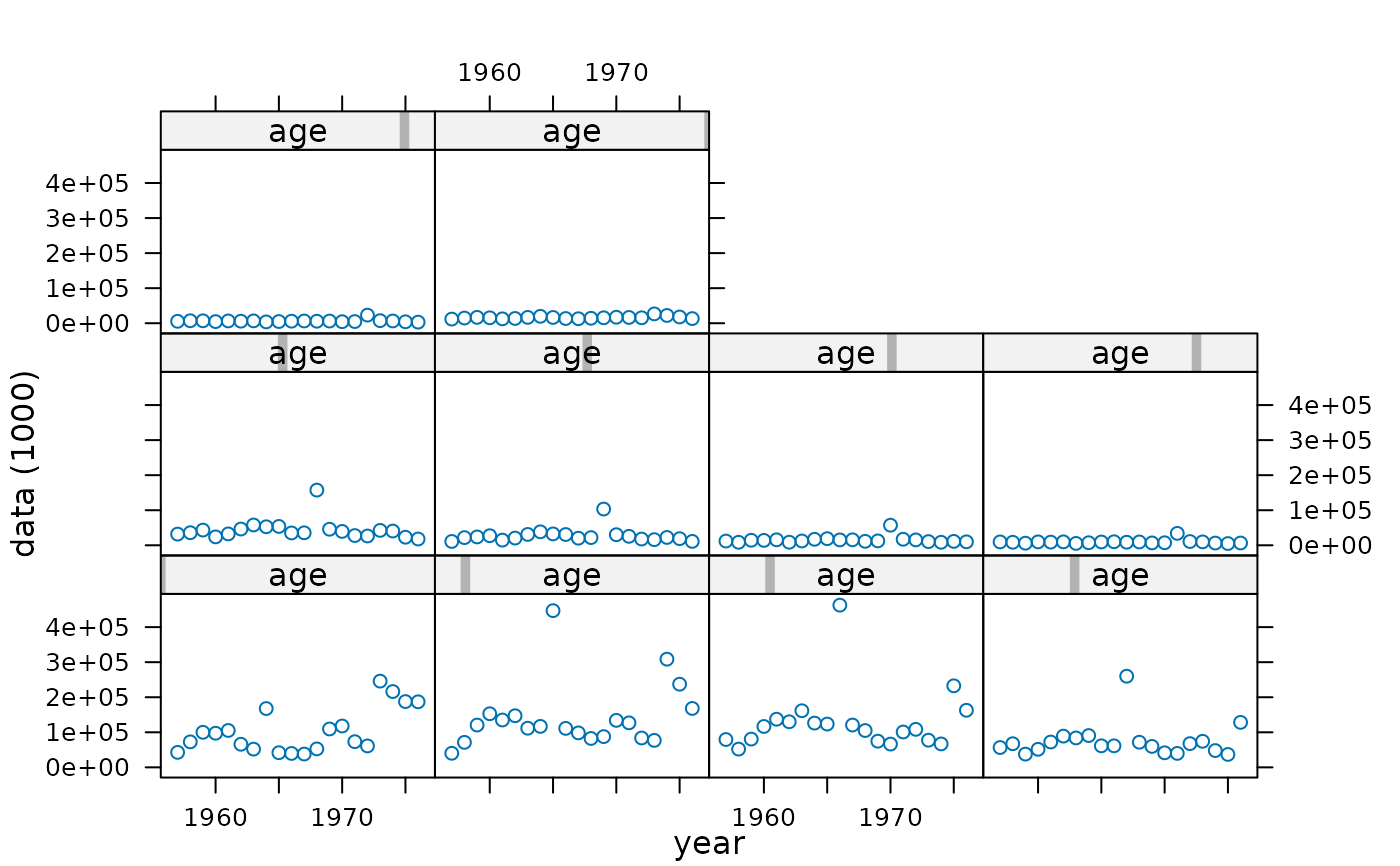
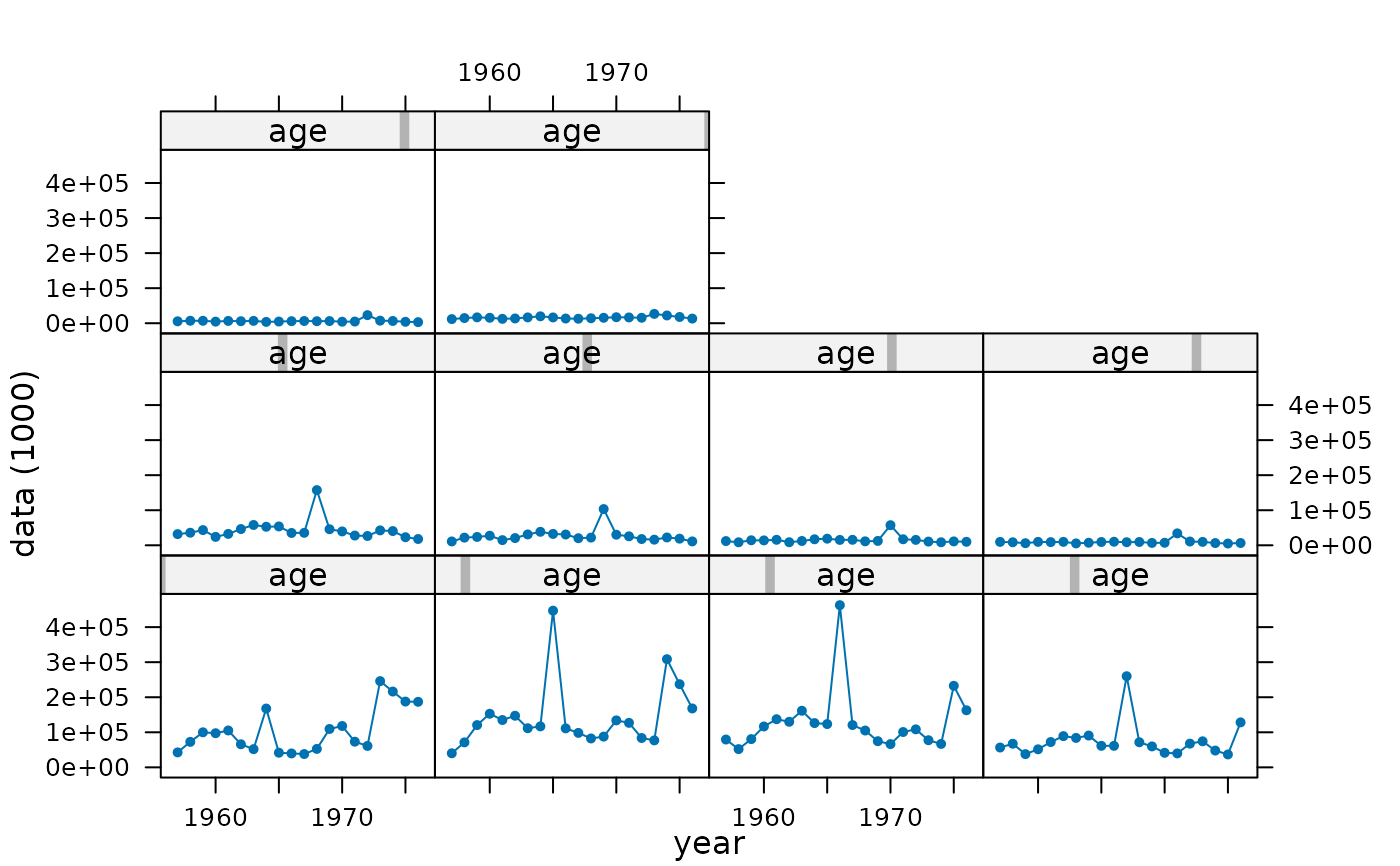
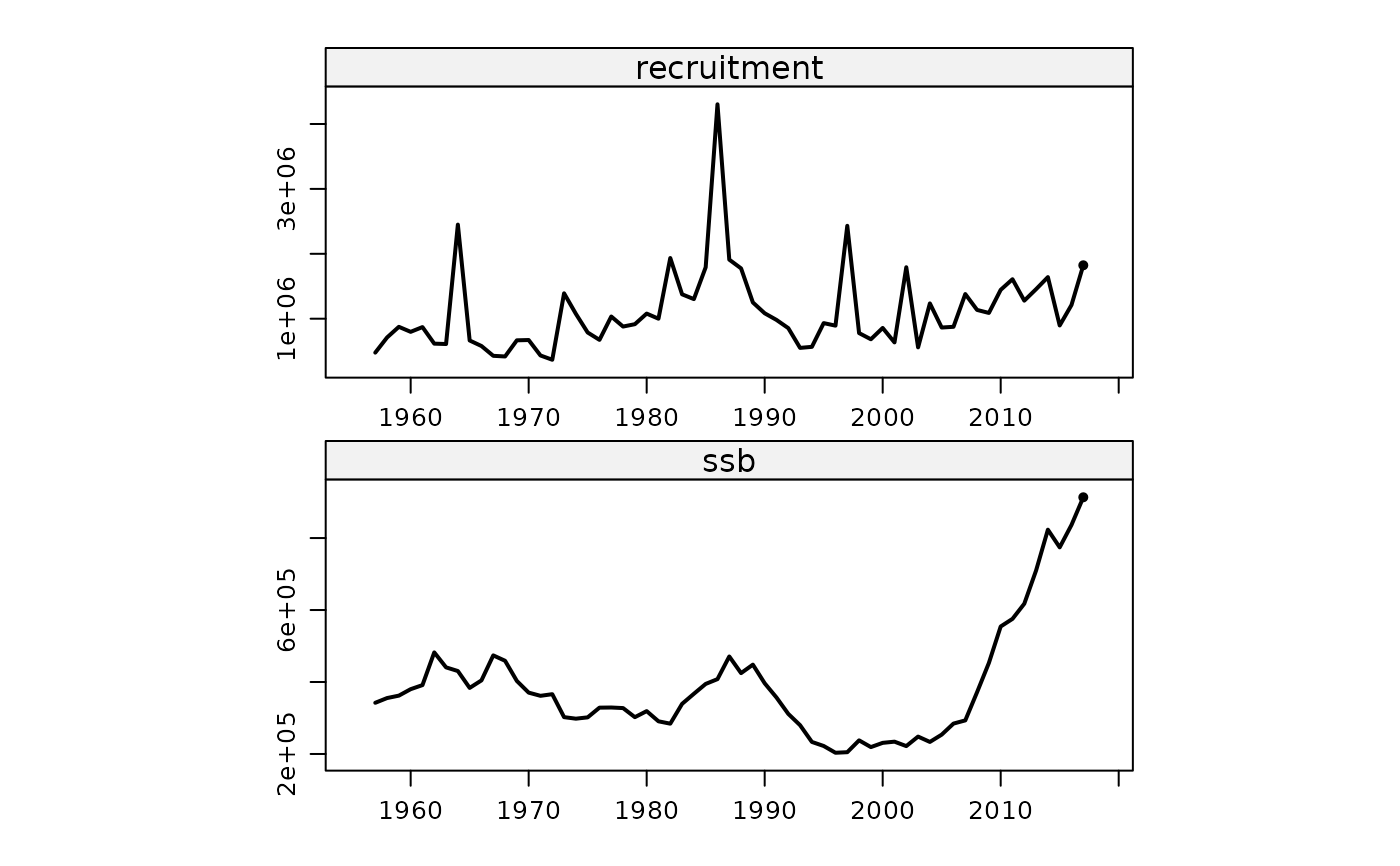
 # FLBiol
data(ple4.biol)
plot(ple4.biol)
# FLBiol
data(ple4.biol)
plot(ple4.biol)
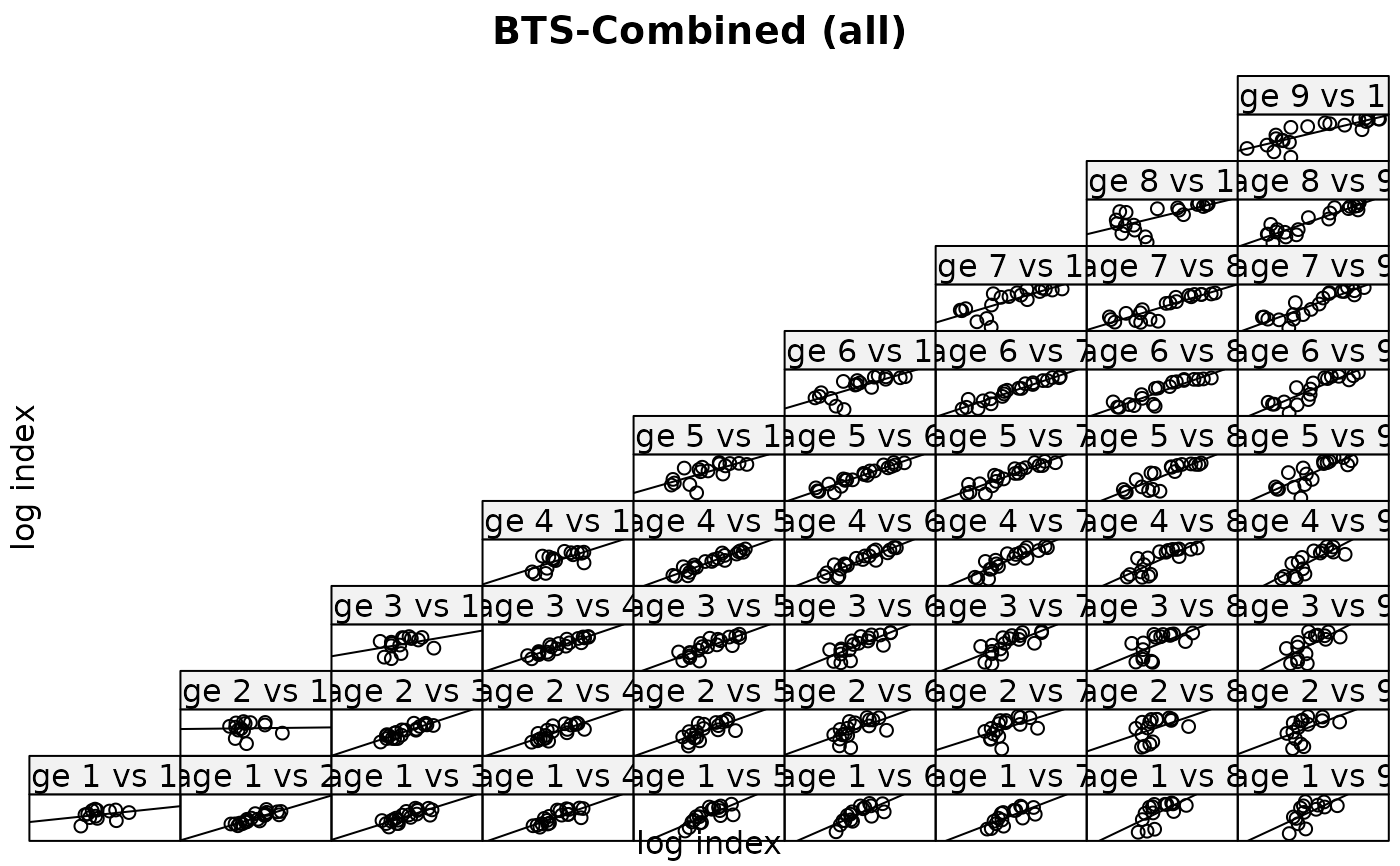
 # FLIndex
data(ple4.index)
plot(ple4.index)
#> Warning: coercing argument of type 'double' to logical
# FLIndex
data(ple4.index)
plot(ple4.index)
#> Warning: coercing argument of type 'double' to logical
 # FLSR
data(nsher)
plot(nsher)
# FLSR
data(nsher)
plot(nsher)
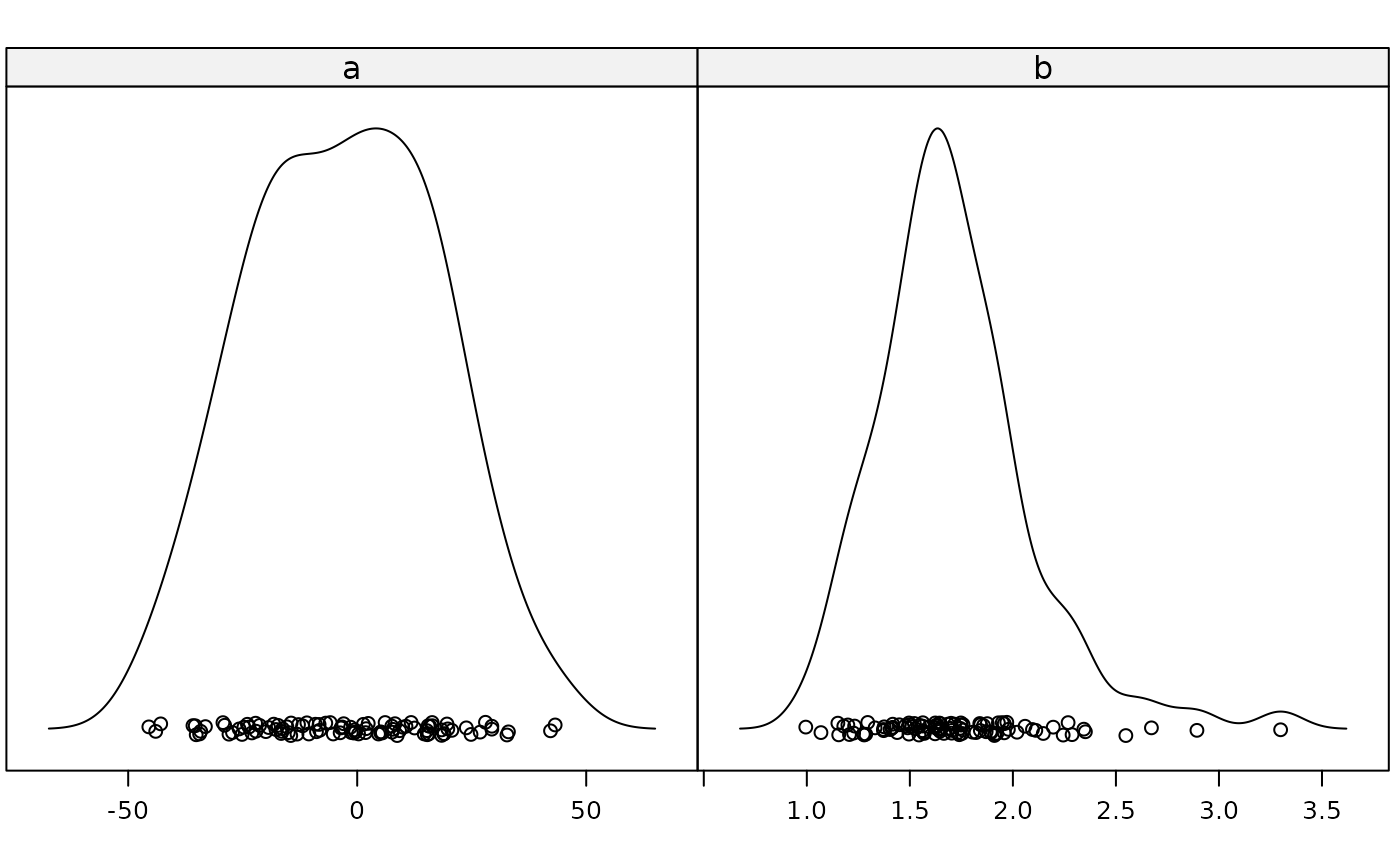
 # FLPar
fpa <- FLPar(a=rnorm(100, 1, 20), b=rlnorm(100, 0.5, 0.2))
plot(fpa)
# FLPar
fpa <- FLPar(a=rnorm(100, 1, 20), b=rlnorm(100, 0.5, 0.2))
plot(fpa)