This `geom` shows a horizontal line for each `param` in a `FLPar` object and labels it using the `param` dimnames, by calling `geom_hline` and `ggrepel::geom_label_repel`. Separate labels and lines can be specified for different facets by providing the `data` argument with an object of class `FLPars` in which each element is named as the values of the facetting variable.
geom_flpar(mapping = NULL, data, ..., x, na.rm = FALSE)Arguments
- mapping
Set of aesthetic mappings created by
aes(). If specified andinherit.aes = TRUE(the default), it is combined with the default mapping at the top level of the plot. You must supplymappingif there is no plot mapping.- data
The data to be displayed in this layer. There are three options:
If
NULL, the default, the data is inherited from the plot data as specified in the call toggplot().A
data.frame, or other object, will override the plot data. All objects will be fortified to produce a data frame. Seefortify()for which variables will be created.A
functionwill be called with a single argument, the plot data. The return value must be adata.frame, and will be used as the layer data. Afunctioncan be created from aformula(e.g.~ head(.x, 10)).- ...
Other arguments passed on to
layer(). These are often aesthetics, used to set an aesthetic to a fixed value, likecolour = "red"orsize = 3. They may also be parameters to the paired geom/stat.- x
Position for params labels on the x axis
- na.rm
If
FALSE, the default, missing values are removed with a warning. IfTRUE, missing values are silently removed.
Aesthetics
`geom_flpar` understands the following aesthetics (required aesthetics are in bold). Some aesthetics apply to only one of the two elements, in parenthesis: - `*x*` - `y`, defaults to 90 - `yintercept`, defaults to params value (line). - `label`, defaults to params names. - `alpha` - `colour` - `linetype` (line) - `linewidth` (line) - `fill` (label) - `angle` (label) - `family` (label)
Examples
data(ple4)
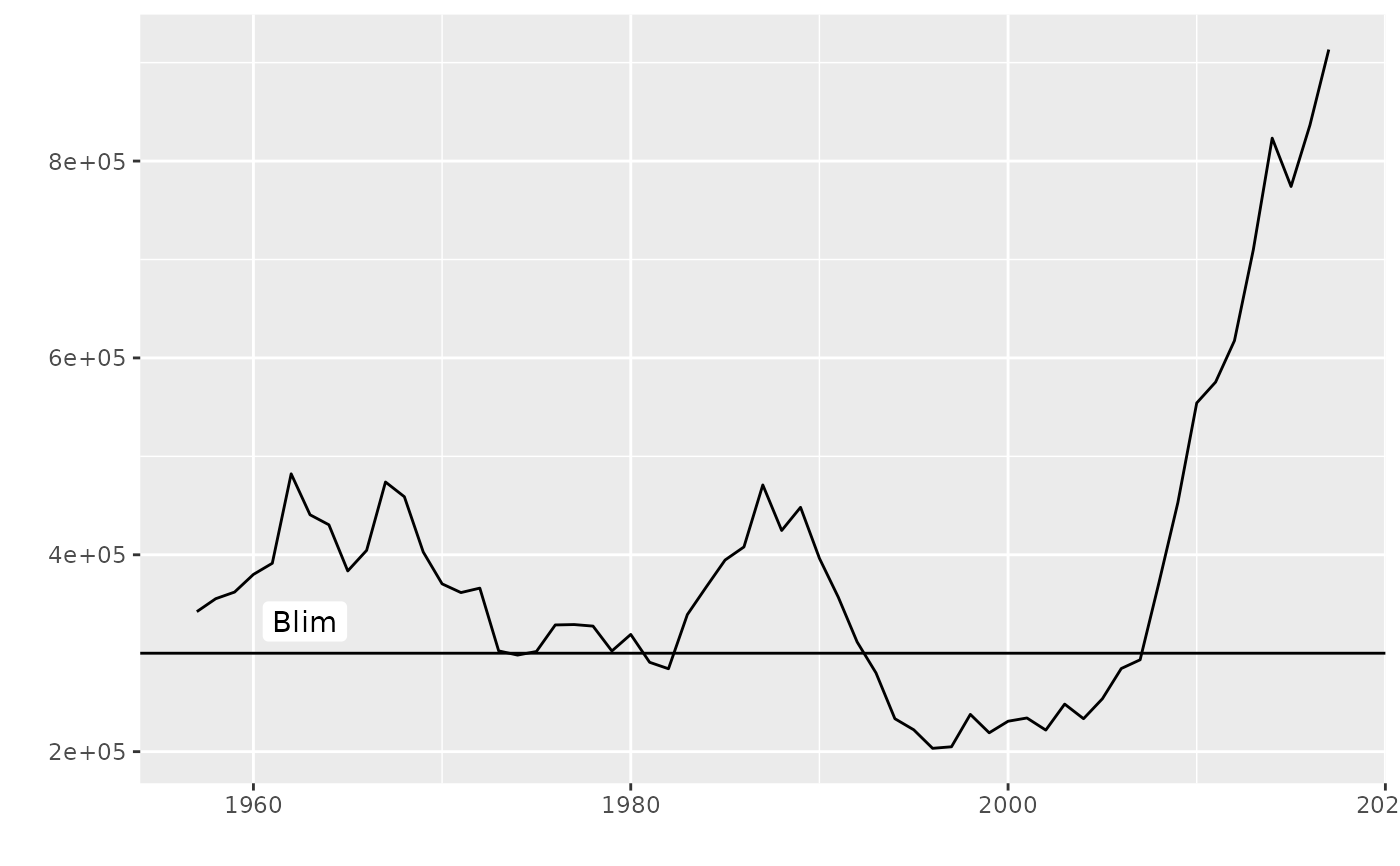
plot(ssb(ple4)) + geom_flpar(data=FLPar(Blim=300000), x=1960)
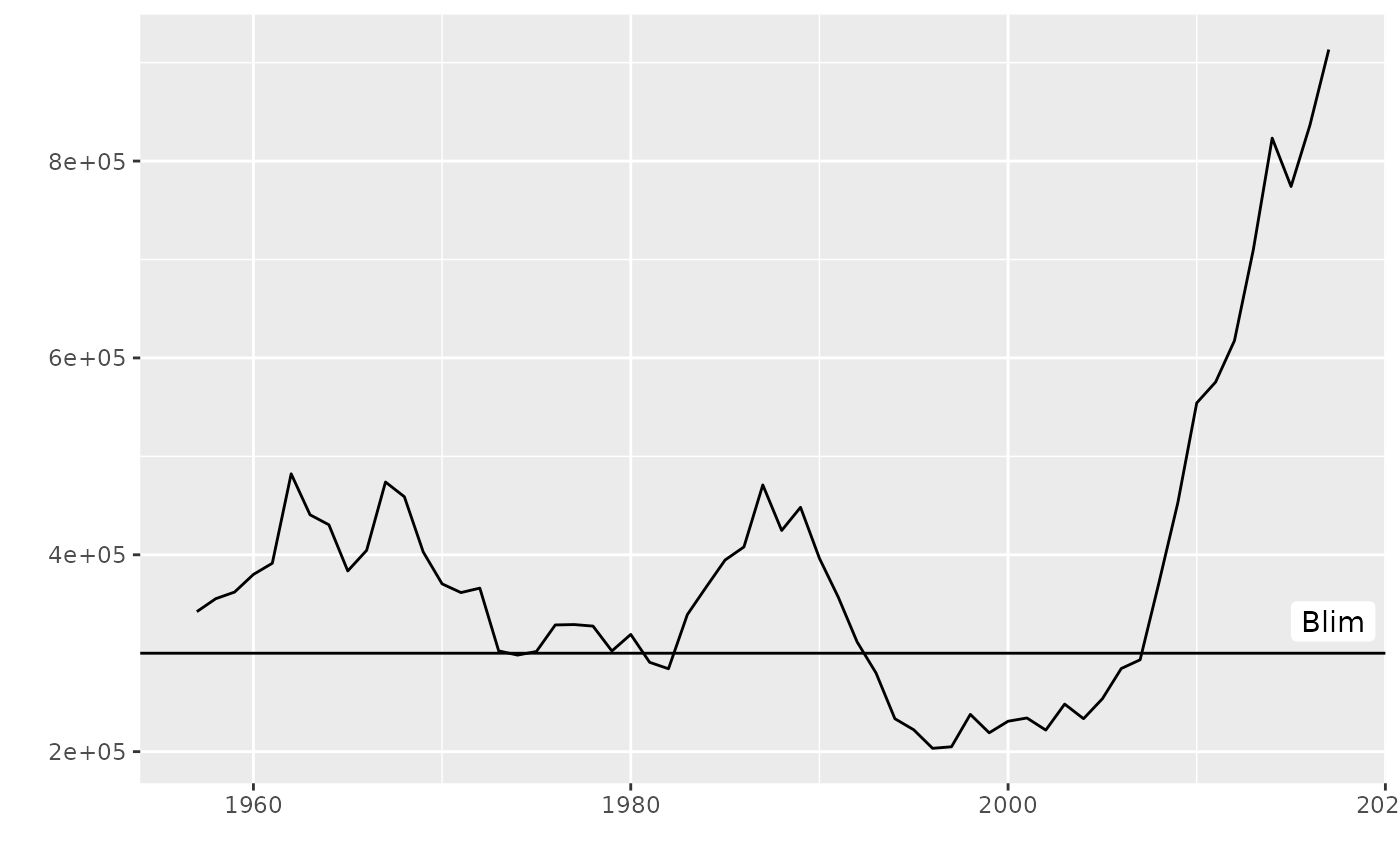
 plot(ssb(ple4)) + geom_flpar(data=FLPar(Blim=300000), x=2015)
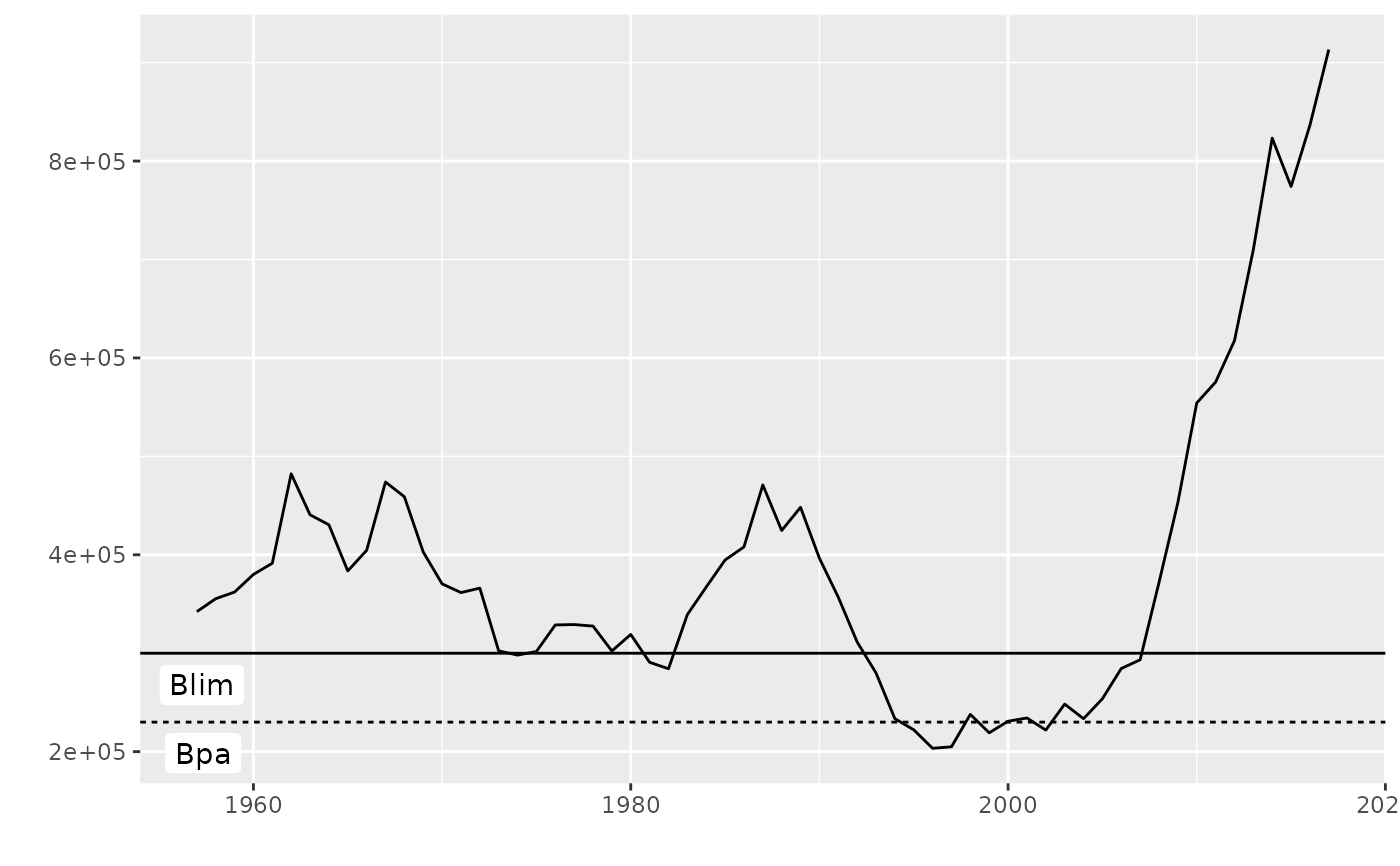
 plot(ssb(ple4)) + geom_flpar(data=FLPar(Blim=300000, Bpa=230000), x=1960)
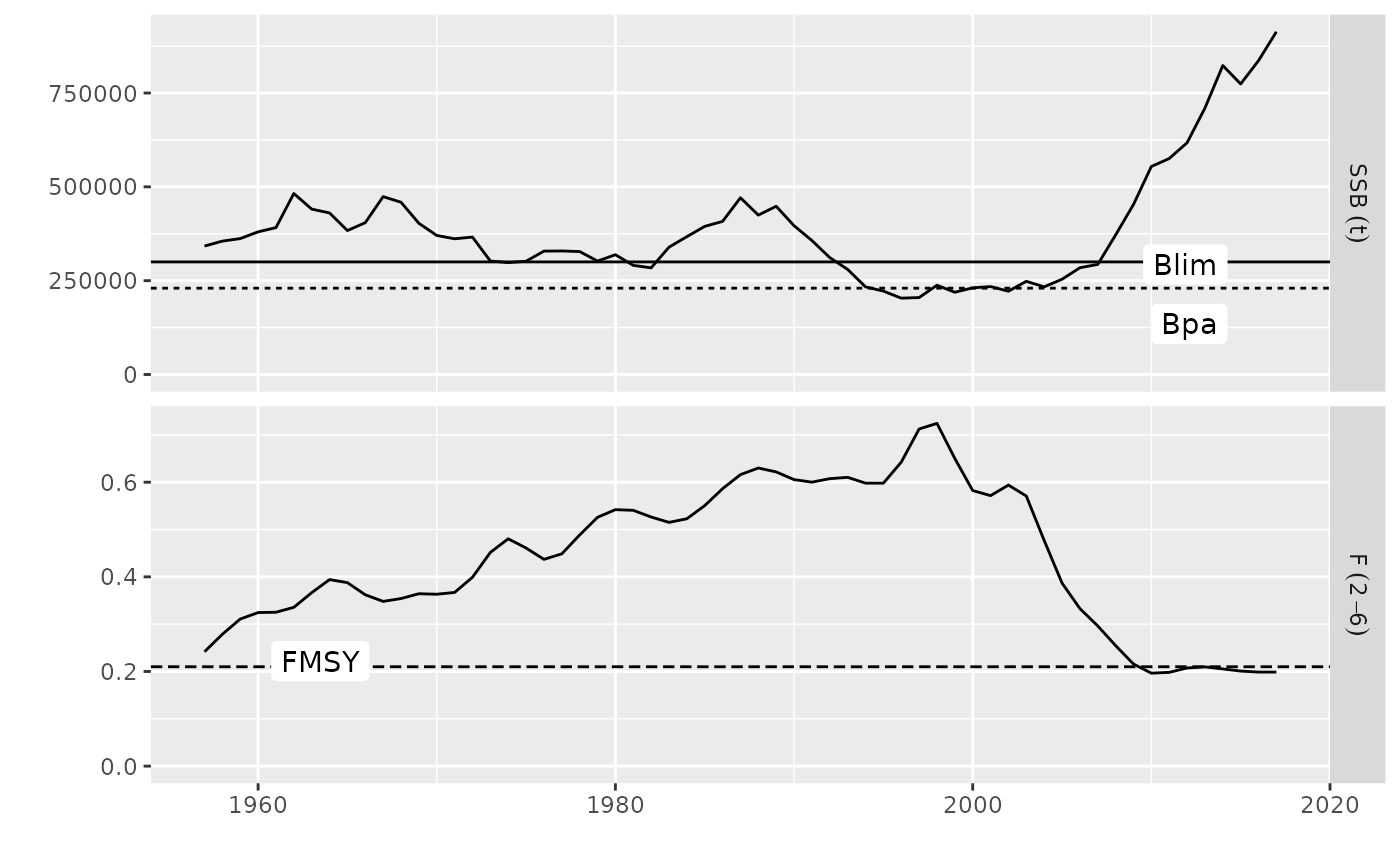
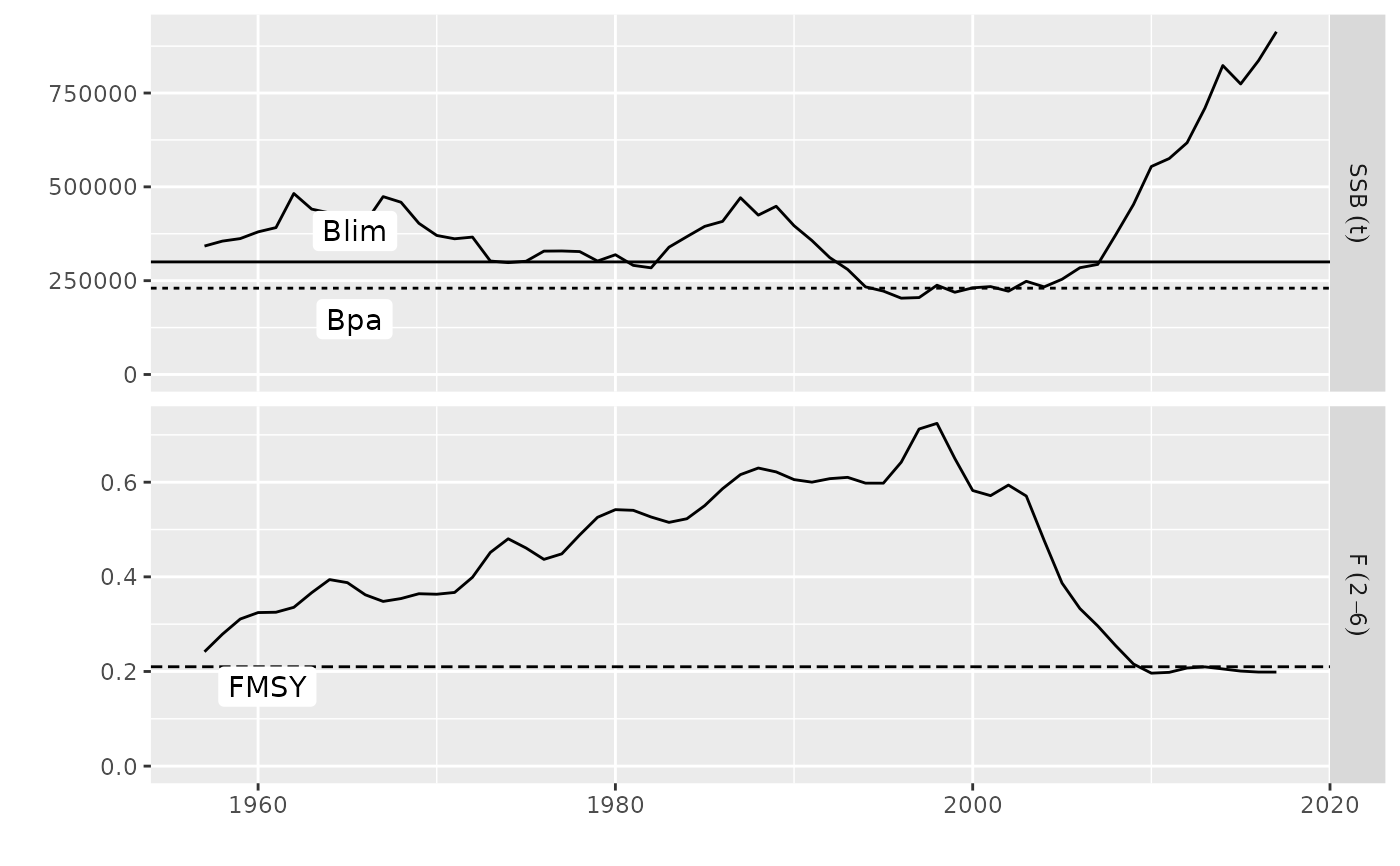
 # geom works for multiple facets, separate params using name-matching FLPars()
plot(ple4, metrics=list(SSB=ssb, F=fbar)) +
geom_flpar(data=FLPars(SSB=FLPar(Blim=300000, Bpa=230000),
F=FLPar(FMSY=0.21)), x=c(1964))
# geom works for multiple facets, separate params using name-matching FLPars()
plot(ple4, metrics=list(SSB=ssb, F=fbar)) +
geom_flpar(data=FLPars(SSB=FLPar(Blim=300000, Bpa=230000),
F=FLPar(FMSY=0.21)), x=c(1964))
 # x and y positions can be altered by param
plot(ple4, metrics=list(SSB=ssb, F=fbar)) +
geom_flpar(data=FLPars(SSB=FLPar(Blim=300000, Bpa=230000),
F=FLPar(FMSY=0.21)), x=c(2015, 2015, 1960), y=c(340000, 180000, 0.18))
# x and y positions can be altered by param
plot(ple4, metrics=list(SSB=ssb, F=fbar)) +
geom_flpar(data=FLPars(SSB=FLPar(Blim=300000, Bpa=230000),
F=FLPar(FMSY=0.21)), x=c(2015, 2015, 1960), y=c(340000, 180000, 0.18))