plot methods that highlight years in fwdControl
plot method for FLStocks, fwdControl
Arguments
- x
FlStock object to plot
- y
fwdControl from which to extract year ranges
- fill
Colour to fill projection years background
- ...
Any other argument to be passed to [ggplotFL::plot]
Generic function
plot(x, y)
Examples
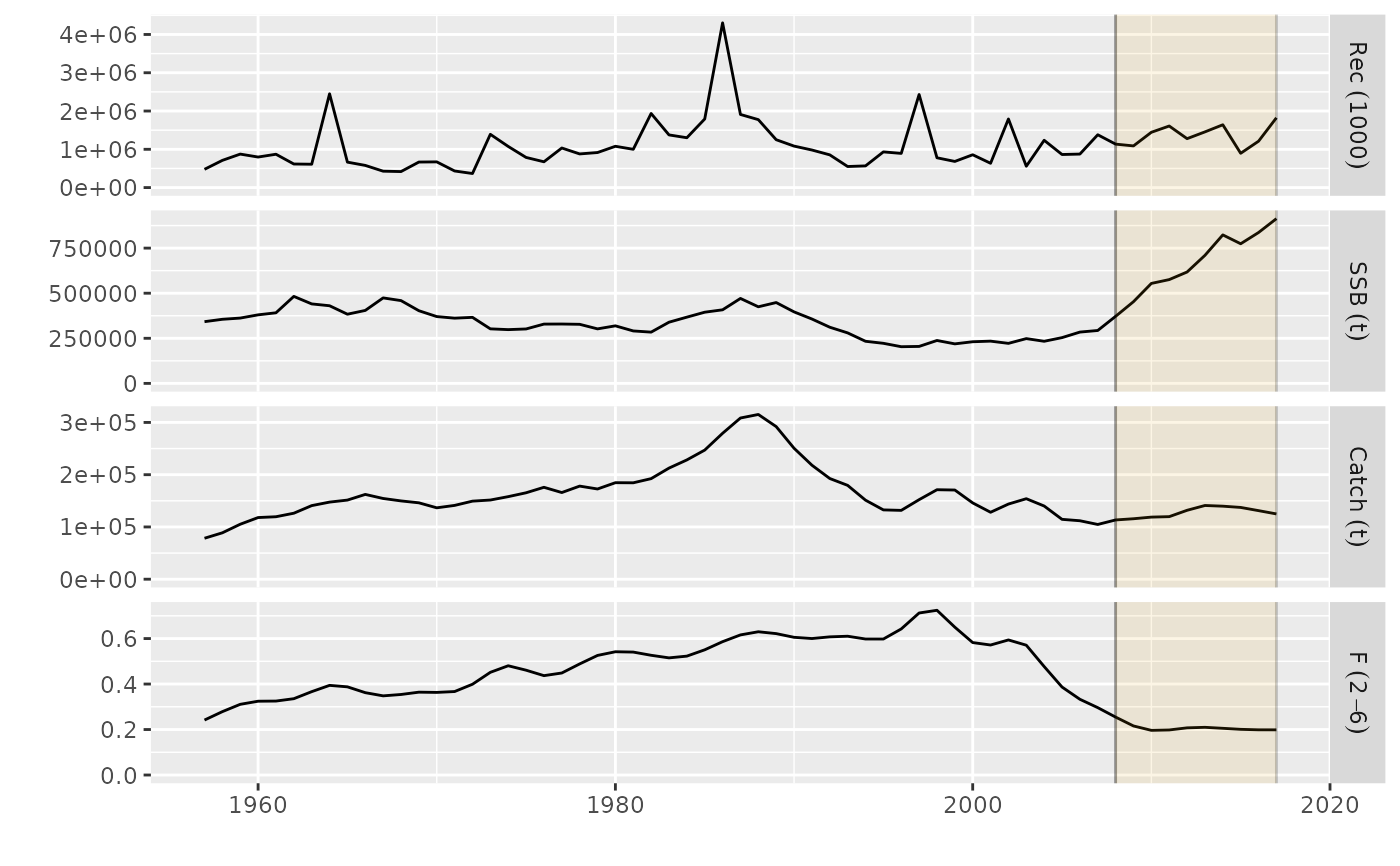
data(ple4)
control <- fwdControl(year=2008:2017, quant="f", value=0.3)
# No fwd projection took place, simply passing year range
plot(ple4, control)
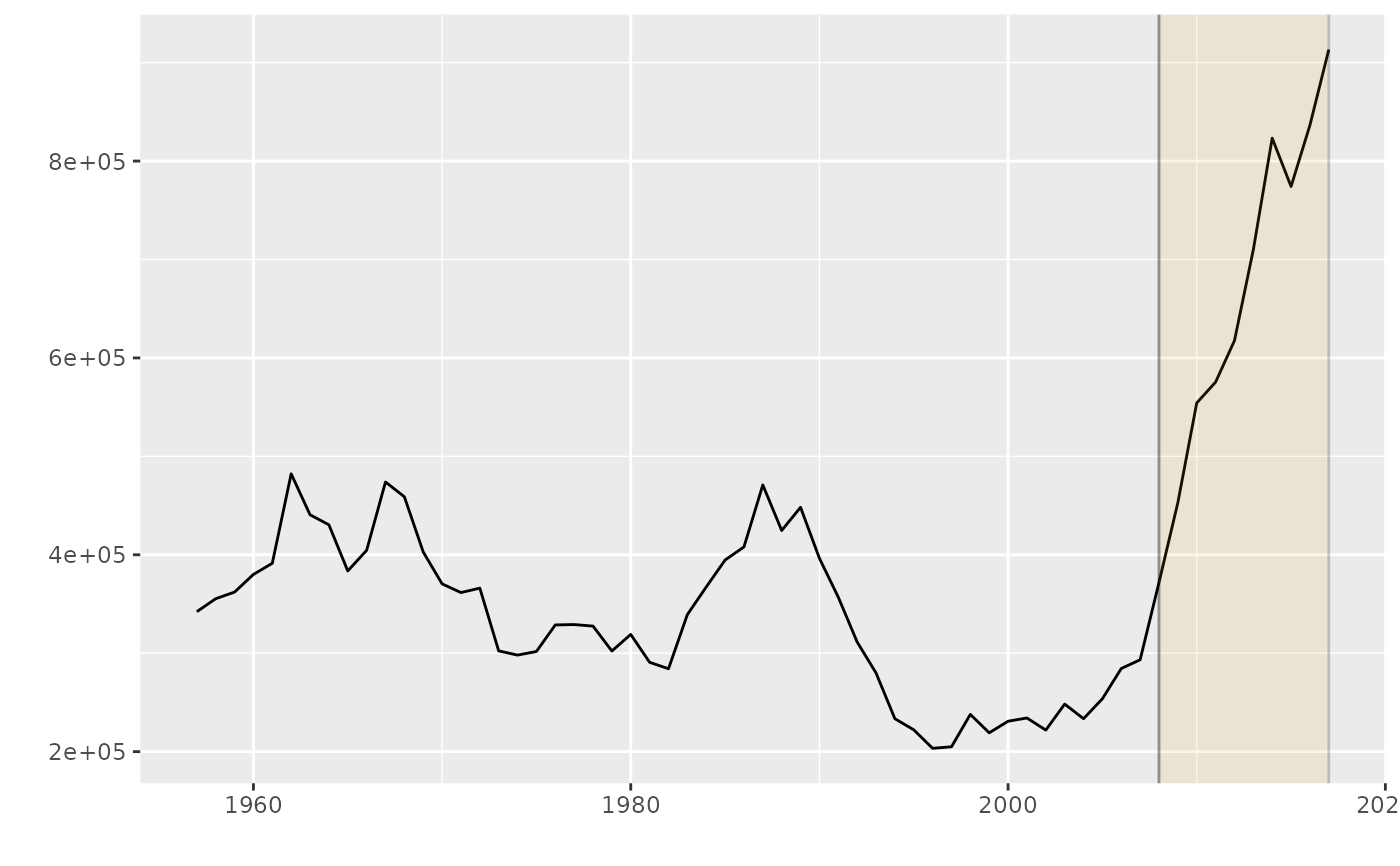
 plot(ssb(ple4), control)
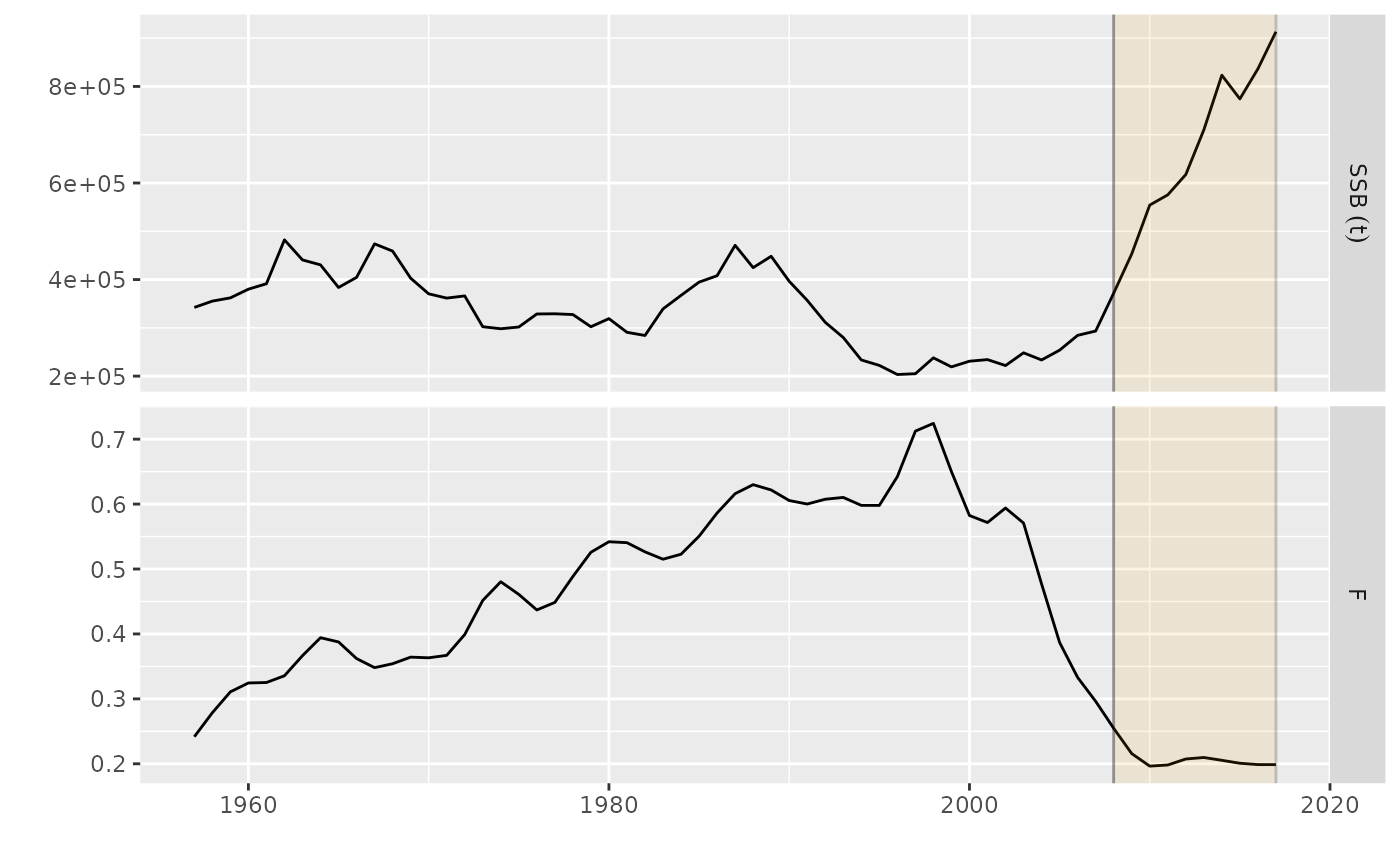
 plot(FLQuants(SSB=ssb(ple4), F=fbar(ple4)), control)
 data(ple4)
control <- fwdControl(year=2008:2017, quant="f", value=0.3)
# No fwd projection took place, simply passing year range
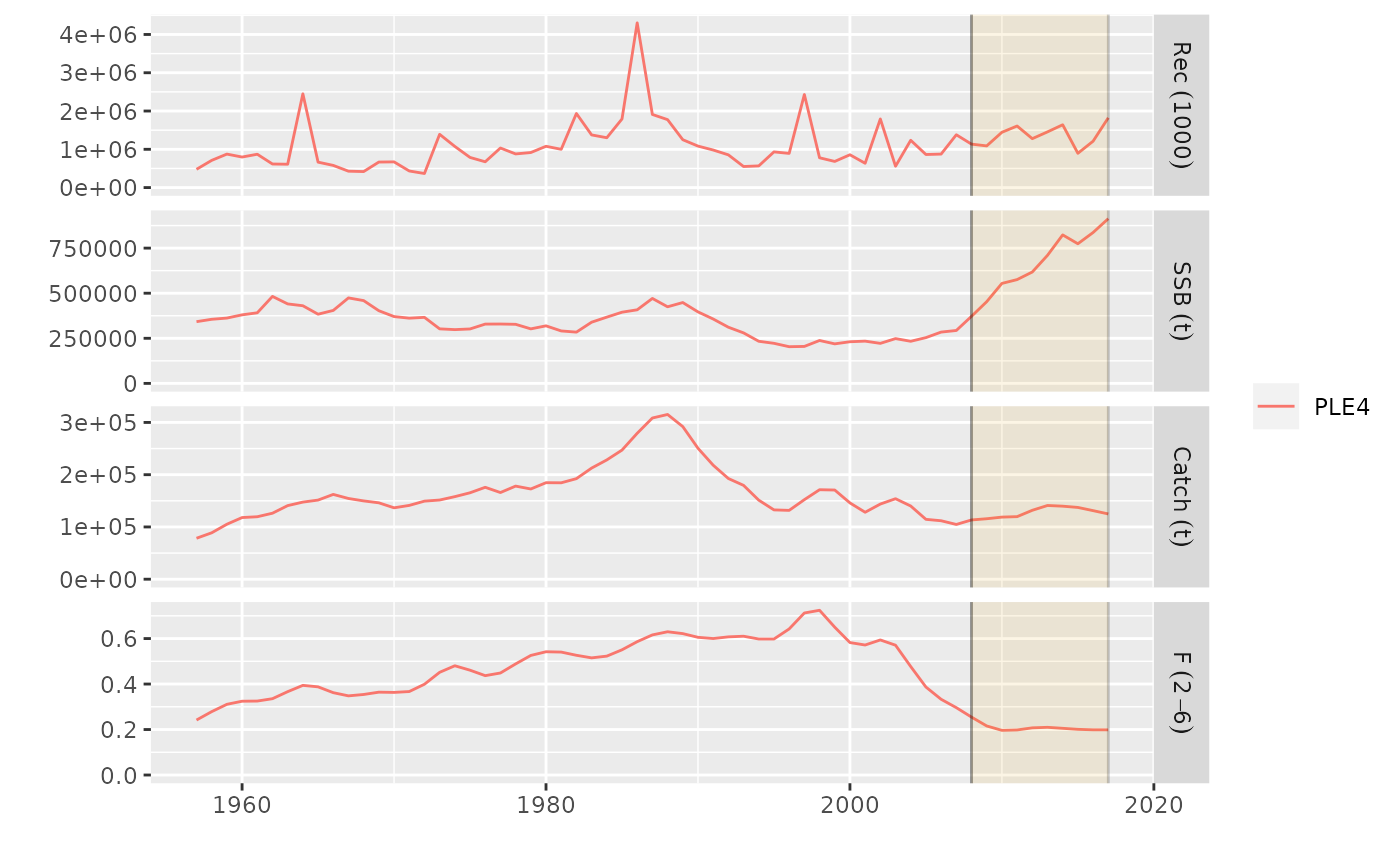
plot(FLStocks(PLE4=ple4), control)
data(ple4)
control <- fwdControl(year=2008:2017, quant="f", value=0.3)
# No fwd projection took place, simply passing year range
plot(FLStocks(PLE4=ple4), control)