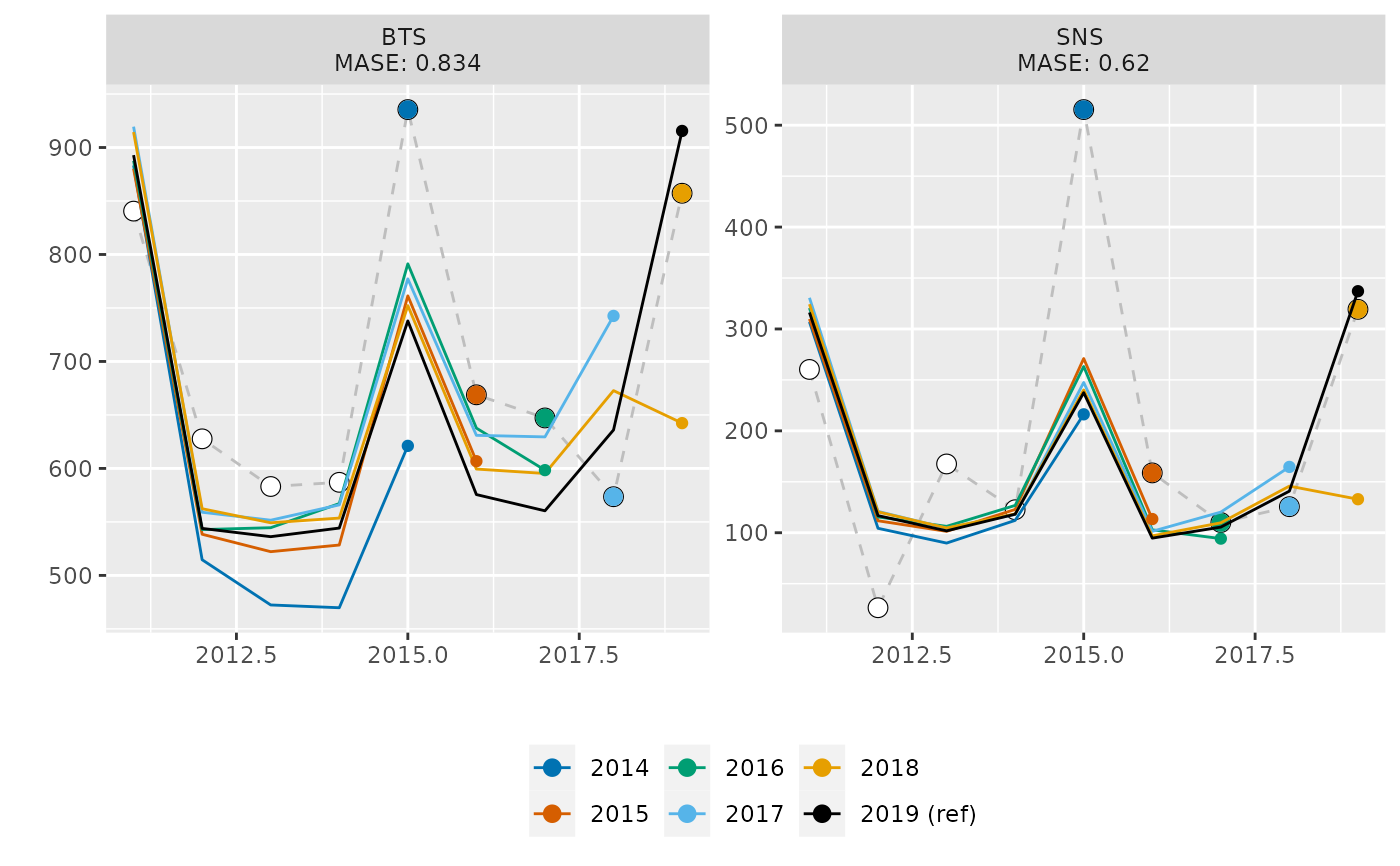
Compute a retrospective hindcast cross-validation of a4a stock and indices
a4ahcxval.RdThe output of a4ahcxval consist of a list with two elements, named 'stocks'
and 'indices'. The first is an object of class FLStocks, each a peel from
the restrospective run. The second element is a list of FLIndices object.
The first FLIndices object, named 'data', is a copy of the input 'indices'
argument, with the additoned catch.n slot, if originally missing. The next
element, named as the final year of the data set, contains the naive prediction
of the input FLIndices, while the remaining elements are the result of a
hindcast prediction of the relevant indices, those within the year range of
as set ny nyears.
a4ahcxval(stock, indices, nyears = 5, nsq = 3, check.ks = FALSE, ...)Arguments
- stock
Input FLStock object.
- indices
Input FLIndices object.
- nyears
Number if years for retrospective, defaults to 5.
- nsq
Number of years for average biology and selectivity, defaults to 3.
- ...
Any submodels and other arguments for the call to sca.
- fixed.ks
Is the number of knots is splines with 'year' constant?
Value
A list containing elements 'stocks', of class FLStocks, and 'indices', a list of FLIndices objects. See details for structure of this list.
Examples
data(sol274)
 # models
fmod <- ~te(replace(age, age > 8, 8), year, k = c(4, 22)) +
  s(replace(age, age > 8, 8), k=4) +
  s(year, k=22, by=as.numeric(age==1))
qmod <- list(~s(age, k=3), ~s(age, k=3))
vmod <- list(~s(age, k=3), ~s(age, k=3), ~s(age, k=3))
srmod <- ~factor(year)
# RUN xval
xval <- a4ahcxval(stock, indices, fmodel=fmod, qmodel=qmod, vmodel=vmod)
#> Warning: executing %dopar% sequentially: no parallel backend registered
# PLOT result
plotXval(xval$indices)